


SVG Nexus
SVG Nexus
Data & Analytics
Goodbye — The Dissolving Silhouette
A tranquil architectural form dissolving cleanly into the air representing total data erasure.
SVG Nexus visual library
Charts, KPI dashboards, business intelligence, and reporting SVG illustrations. Browse 68 verified open-source Data & Analytics SVG illustrations with preserved creator credit and browser-based vector editing.
Every set is an individually license-verified library. Open one to browse its artwork.
Showing 24 of 68 illustrations. Page 1 of 3
A tranquil architectural form dissolving cleanly into the air representing total data erasure.

A clear metrics dashboard combines summary cards, trend lines, and a compact bar chart.

A data-storytelling scene for Anomaly alert console, combining a clear analytical focal point with readable measures and a forecast or workflow cue.

A data-storytelling scene for Benchmark comparison board, combining a clear analytical focal point with readable measures and a forecast or workflow cue.

3D isometric data lakehouse funneling massive streaming ingestion pipes into partitioned bronze, silver, and gold tiers.

Streams of structured records converge on a high-capacity processing engine.

A team reviews a shared insight board and turns evidence into a confident decision.

A data-storytelling scene for Business metrics digest, combining a clear analytical focal point with readable measures and a forecast or workflow cue.

A marketing funnel and performance chart reveal how an audience becomes engaged.

A data-storytelling scene for Campaign attribution model, combining a clear analytical focal point with readable measures and a forecast or workflow cue.
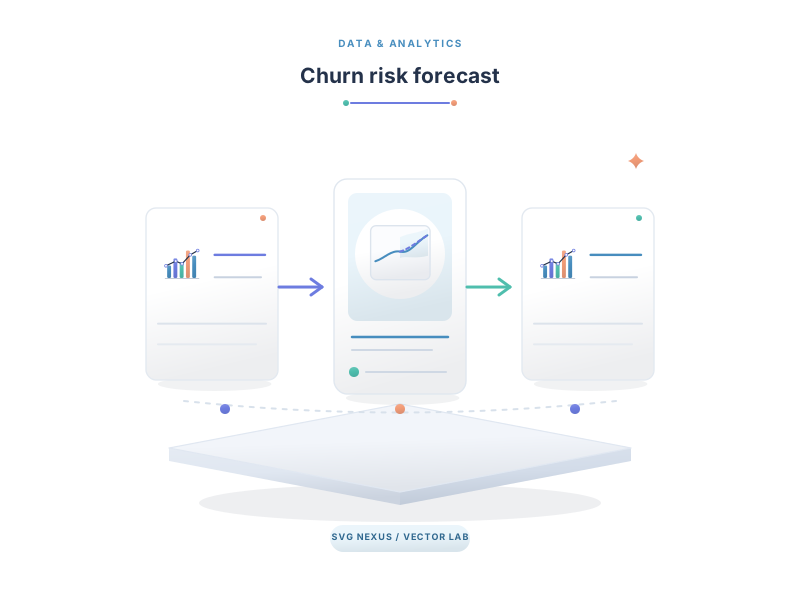
A data-storytelling scene for Churn risk forecast, combining a clear analytical focal point with readable measures and a forecast or workflow cue.

A data-storytelling scene for Clinical outcomes dashboard, combining a clear analytical focal point with readable measures and a forecast or workflow cue.
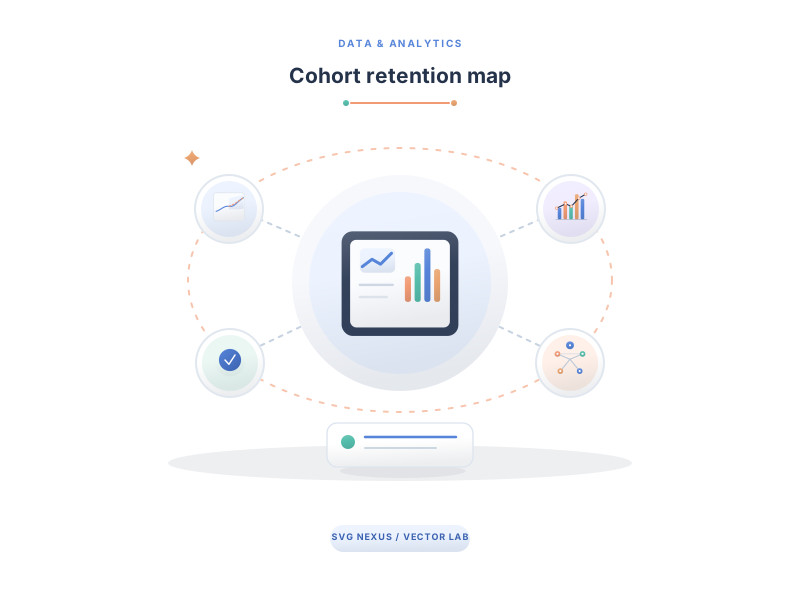
A data-storytelling scene for Cohort retention map, combining a clear analytical focal point with readable measures and a forecast or workflow cue.

A data-storytelling scene for Conversion path review, combining a clear analytical focal point with readable measures and a forecast or workflow cue.
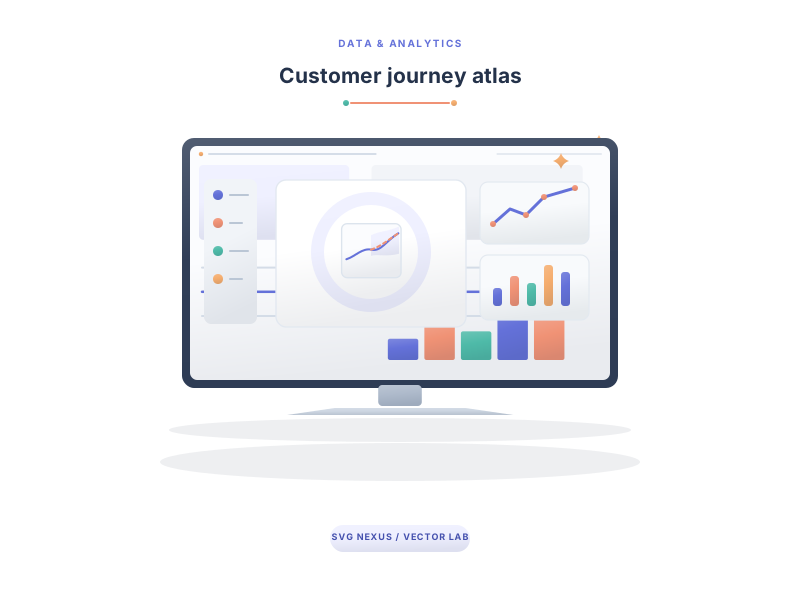
A data-storytelling scene for Customer journey atlas, combining a clear analytical focal point with readable measures and a forecast or workflow cue.

A data-storytelling scene for Customer lifetime value, combining a clear analytical focal point with readable measures and a forecast or workflow cue.
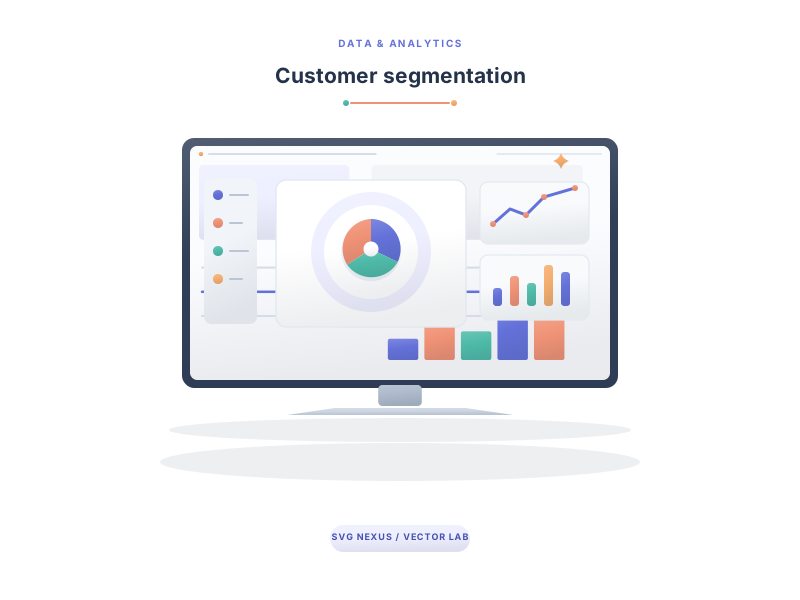
A data-storytelling scene for Customer segmentation, combining a clear analytical focal point with readable measures and a forecast or workflow cue.

A data-storytelling scene for Data access audit, combining a clear analytical focal point with readable measures and a forecast or workflow cue.

3D isometric business intelligence platform with stepped bar columns, extruded donut chart, and revenue spline.

A data-storytelling scene for Data catalog browser, combining a clear analytical focal point with readable measures and a forecast or workflow cue.

A data-storytelling scene for Data quality scorecard, combining a clear analytical focal point with readable measures and a forecast or workflow cue.

Two coupled mechanical pendulums aligning harmonic oscillation into synchronized state.

Parallel sinusoidal data streams aligning their crests into synchronous harmony.

A three-dimensional chart turns a set of figures into a readable visual comparison.
Loosen a filter or try a broader word — the search also understands related ideas like “people”, “money”, or “holiday”.
Use the heart on any illustration to keep it in your browser's saved collection.
A little about SVG
SVG illustrations are vector graphics, so they stay crisp at every size. Browse each verified collection, check artwork against light, dark, or transparency previews, keep favourites in your browser, then open any file in the studio to keep editing. License and author details travel with every asset.